Opens in a new tab

AI reporting and custom business dashboards

Know the numbers before the meeting

Your numbers live in six places and rarely agree. We connect them into one custom dashboard, then AI reporting explains what changed, why, and what is worth doing about it, in your inbox before the Monday meeting.
★★★★★5.0 across 53 Google reviews
Your first dashboard, live in month oneOn either build, on your real data, not a template with your logo dropped on it.
One set of numbers everyone trustsReconciled across your accounts, CRM, website and ad platforms, so meetings start with decisions, not arguments.
Written in plain EnglishNot thirty charts to interpret. What changed, why, and what it means, in a paragraph you can actually use.

How AI reporting works

What AI reporting does for your business

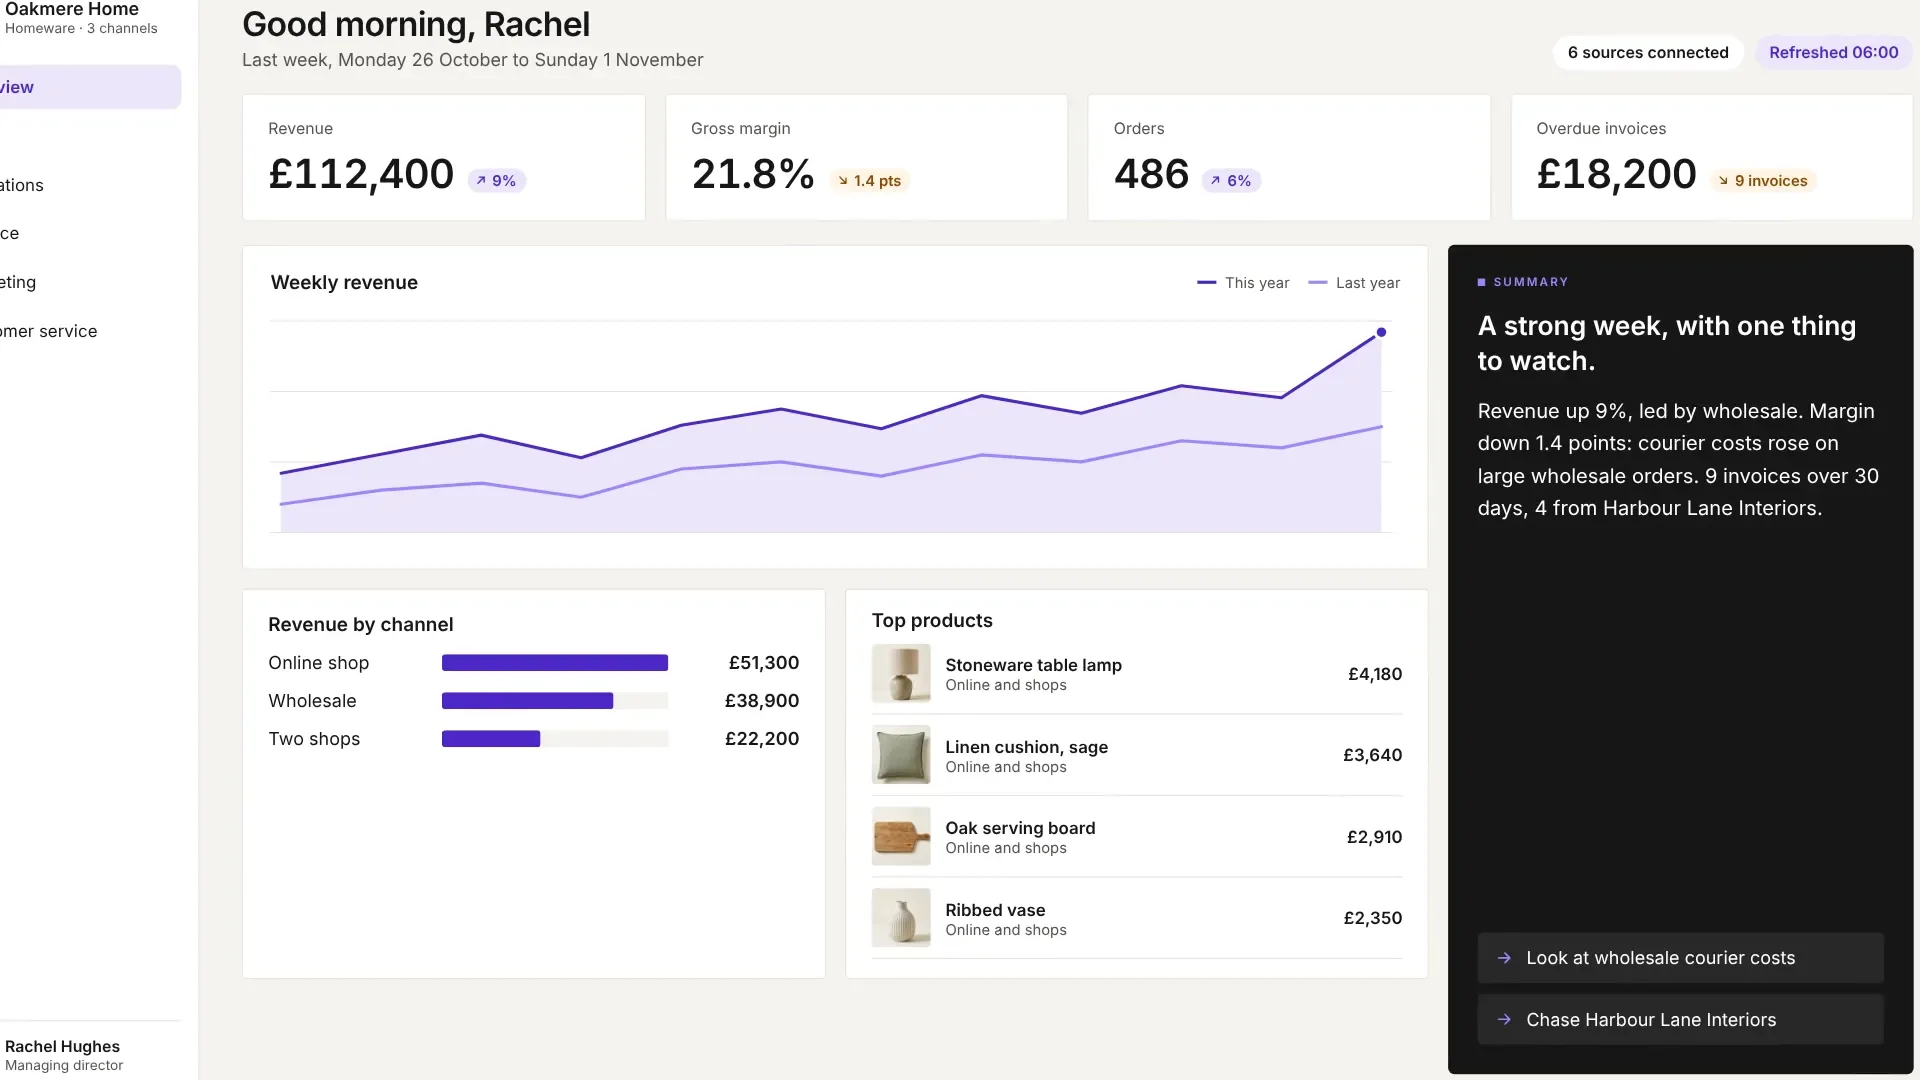
AI reporting connects the systems you already use, makes the figures agree, and explains them in plain English. Here is what that looks like for an example homeware brand that sells online, wholesale and through two shops.

01

Connect everything you run

Accounts, online shop, CRM, ad platforms and the spreadsheet nobody admits to. We connect them all, so every figure comes from one place and nobody exports a CSV again.

02

Make the numbers agree

Every system counts differently. We agree the definitions with you, like whether revenue includes VAT and refunds, and reconcile everything to your accounts. One figure, written down, that everyone trusts.

03

Explain it in plain English

AI reads the movements in your data and writes what changed, why, and what is worth doing about it, checked against the reconciled figures. A paragraph you can act on, not thirty charts to interpret.

04

Alert you, then report to you

Set the rules that matter, like margin under 18% or invoices past 30 days, and hear about it the day it happens. Each team gets its own report by email, before the meeting.

The example business is fictional. Your dashboard is built around the numbers your business actually runs on.

Who this works for

Sound familiar? This is who we build reporting for

Industry matters less than the symptom. Most businesses we work with recognise at least two of these.

01Where most clients start

Your numbers live in six places

Revenue is in the accounts, orders in the shop, the pipeline in the CRM, and the rest in somebody's head. A straight answer takes a morning.

Common in: any business past about ten people

One dashboard, refreshed every morning
02

Nobody trusts the report

Every meeting starts by arguing about whose number is right, so decisions wait another week.

Common in: anywhere two systems disagree

Definitions agreed and written down
03

You find out too late

Margin slipped in week one and you found out at month end, when the money had already gone.

Common in: anyone running on monthly reporting

An alert the day a number moves
04

Reporting eats real days

Someone expensive spends two days a month exporting, pasting and fixing broken formulas.

Common in: finance and operations teams

The report builds and sends itself
05

You run several sites or teams

You cannot compare branches or people fairly, because everyone measures slightly differently.

Common in: multi-site retail, hospitality, trades and services

Every site measured the same way
06

A big decision is coming

Hiring, opening a site or dropping a product line, and the data to back it up does not exist yet.

Common in: anyone planning the next twelve months

The numbers to decide with, in weeks
What we build for you

Watch a dashboard build itself

Pick a business type and watch us connect the sources, reconcile the numbers and write the summary. This is what lands on your screen every morning.

Your dashboardConnecting your sources
  
This morning’s summaryWritten for you, not generated noise

Built by hand15 days a month
Nowlive
Refreshedevery morning, 6am

Illustrative examples using representative figures. Every dashboard we build is designed around the numbers your business actually runs on, and the real builds are just below.

Reporting, delivered

The report comes to you

Most people never open a dashboard. They will read an email. So every dashboard we build also sends itself, on whatever schedule suits, to whoever needs it, written in plain English rather than dumped as a wall of charts.

Different reports for different people. The board gets the summary, the sales manager gets their pipeline, the warehouse gets what shipped late.
Daily, weekly, monthly, or when something moves. Set a threshold and it tells you the moment margin drops or a target slips.
Written, not generated noise. What changed, why it changed, and what is worth doing about it.
Branded as yours. Your logo, your colours, sent from your domain, so it looks like your business built it.
DB
Monday numbers
reports@yourcompany.co.uk · 06:02
Weekly email

Morning. Last week in one line: a strong week on volume, a weak one on margin.

Revenue
£112,400
+9%
Margin
21.8%
−1.4 pts
Orders
486
+6%

Revenue beat the four-week average by 9%, driven almost entirely by two large trade orders rather than a broad lift. Margin slipped to 21.8% because those two orders were priced at the old rate before the supplier increase came through.

▲
Worth a look: 9 invoices moved past 30 days this week, £18,200 in total.

Full dashboard is live if you want to dig in. Reply to this email if you want anything added.

An example of the weekly email that comes with every dashboard we build.

Dashboards for every team

Sales, finance, operations and marketing dashboards from one set of numbers

Each team gets its own view and its own report, built on the same reconciled data, so nobody keeps a private spreadsheet. Pick a team to see what lands on their screen.

Sales viewLive, refreshed 06:00
Pipeline£486k+12%
Win rate34%+3 pts
Quotes going cold7£41k
Value won, by week
This morning’s summary

Pipeline is up 12% this month, mostly from referrals. Seven quotes worth £41k have had no reply for ten days, and the largest is £14,200.

A quote over £10k has had no reply for 10 days

Illustrative figures from an example business.

What the sales view answers

  • Pipeline value and movementWhat is in the pipeline, what moved this week, and what has gone quiet.
  • Quote and win ratesHow many quotes went out, what was won, and how that compares to a normal month.
  • Source of every saleWhich channel, campaign or referral produced revenue, checked against the accounts.
  • Rep and team performanceA fair comparison across the team, on the same definitions.
  • Quotes going coldEvery open quote, sorted by value and age, so the next chase is obvious.

Before: Sales runs on gut feel and whichever spreadsheet was updated last.

After: Everyone sees the same pipeline and win rate, so the Monday meeting is about the next move.

Plugs into

  • HubSpot
  • Pipedrive
  • Salesforce
  • Outlook
  • WhatsApp
  • Xero
Talk to us about sales reporting

We pull from everything you
already run

Nothing gets replaced. If your data lives in it, we can almost certainly read it, including the spreadsheet nobody wants to admit to.

CRM & salesHubSpot, Salesforce, Pipedrive, Zoho, HighLevel, Monday
Accounts & financeXero, QuickBooks, Sage, Stripe, GoCardless
Web & ecommerceWordPress, WooCommerce, Shopify, Webflow, Magento
Email, chat & calendarsOutlook, Google Workspace, Slack, Teams, WhatsApp
Files, data & projectsSharePoint, Google Drive, Dropbox, Notion, Airtable, ClickUp
ReportingGA4, Google Ads, Meta Ads, Looker, Power BI

We build on Power BI, Looker Studio or a custom web dashboard, whichever suits your team and budget. We are not tied to one vendor, so we choose by fit. And if your data lives somewhere unusual, that is normally solvable too.

How we work

From scattered spreadsheets to one honest view

No months of discovery and no strategy deck that sits in a drawer. Every stage ends with something you can hold, and your first dashboard is live inside month one.

1

The strategy

Metric definitionsAgreed in the strategy
RevenueInvoiced, excluding VAT, after refundsAgreed
Gross marginRevenue less product, packaging and courierAgreed
OrderOne basket, whatever the channelAgreed
OverdueUnpaid 30 days after the due dateTo confirm

Half a day on your numbers, with the people who actually use them. We map where your data lives and how a job really travels from enquiry to cash, then design your dashboard on paper before anything is built.

Where every number lives, and which version of each is true
The views, reports and integrations your dashboard needs, agreed
Metric definitions everyone will trust, written down
Yours to keep whatever you decide next. £995 £495, credited off your build
Within a fortnight
2

Your first dashboard goes live

Weekly viewLive
Revenue£112,400+9%
Margin21.8%−1.4 pts
Orders486+6%

We do not build for six months and hope. We take the single best opportunity from the blueprint and put it into production, in your systems, on your data, with the rules agreed with you.

One live dashboard on your real, reconciled data
Built inside the software you already run
Every metric defined and agreed with you, then written down
Documentation and a training session so your team can use it
Inside month one, on either build
3

Roll it out further

Reporting roadmapFrom the same reconciled data
Board viewLive
Finance pack and forecastLive
Sales and pipelineLive
Operations and stockBuilding
Marketing returnNext

With one view proving itself, we work down the roadmap. More departments, deeper sources, automated reports going out to the people who need them, and alerts when something moves.

Department and site views from the same reconciled data
Integrations into your CRM, accounts, website and comms
Dashboards showing what ran, what it saved and what needed a human
Automated reports, and agents that act on what they show
Typically 60 to 90 days
4

Run, improve and hand over

Care logThis week
  • All six sources refreshed and checked
  • Monday report sent to four teams
  • Online shop renamed a field. Fixed by 09:40
  • Quarterly review: what the numbers say

Reporting breaks quietly. A source changes its API, a field gets renamed, a new product line does not fit the old categories, and your business does not stand still either. We monitor, fix and extend, train your team, and document everything.

Monitoring, so a broken source is fixed before you notice
Small changes and tweaks included in your monthly care
A quarterly call on what the numbers say, on Pro
Full ownership of everything built, with no lock-in
Ongoing, and cancellable

94%

less time getting to your numbers

That is roughly the average time saved once the dashboard gathers and reconciles the numbers for you. And the figures come out more reliable, not less.

Building the monthly report

2 days→20 min

You read the two pages that matter, not the thirty

Reconciling sales across your tools

4 hours→8 min

You get one figure that already agrees with the accounts

Pulling a board pack together

1 day→15 min

You add the commentary only you can write

Getting numbers ready for a meeting

2 hours→5 min

You walk in already knowing where you stand

Spotting a product line slipping

3 hours→2 min

You catch it while it still matters

Agreeing one true revenue figure

half a day→live

Nobody argues about whose number is right

Estimates for typical reporting, not results from a specific client. The measured before-and-afters are up in the case studies. What matters is not the exact figure, it is that the time you used to lose gathering and reconciling numbers goes back into using them.

The numbers behind them

Three builds,
and what they could finally see.

Each of these systems reports on itself, so the business sees live numbers instead of waiting on a spreadsheet somebody has to build.

The Remove Spray Foam quoting system built by designbox
Remove Spray Foam
Spray foam removal

Survey in the morning,
quote out the same day

Every quote and every win now reports itself, so they can see conversion and turnaround live instead of guessing. Quotes also went out 5× faster once the numbers were in front of them.

5×faster from survey to quote
4.5×more sales
Same dayquotes out after the morning survey
The Rolling Bean booking and quoting system built by designbox
The Rolling Bean
Mobile coffee bar hire

The whole operation,
in one system

Enquiries, bookings and revenue report themselves in one place instead of hiding in a diary and a spreadsheet. Still being built out, already showing what is actually in the pipeline.

10×faster to get a quote out
Liveview of enquiries, bookings and revenue
Onesystem instead of a phone, a diary and a spreadsheet
The designbox sales and reporting system
designbox
Our own sales and reporting

We ran it on ourselves first

Our sales and reporting used to take seven hours a week to assemble by hand. It reports itself now in 45 minutes of reading, and seeing it live is part of what drove sales up 2.5×.

45 minsto do what used to take seven hours
2.5×sales and sales capacity, within three months
6 hrsback with the sales team, every week


Pricing

Pay once to build it,
then a little to keep it live

A dashboard is a product you own, not a retainer. Strategy first, a fixed-price build, then a small monthly that keeps it hosted, secure and reconciled.

Step one, whichever build you choose

Dashboard and reporting strategy

Half a day on your numbers. We map where your data lives, agree the definitions everyone will trust, and design your dashboard on paper: the views, the reports and the integrations. You leave with the blueprint and a fixed quote for the build.

£495credited off your build

If you decide not to build, the blueprint is still yours to keep, and you can take it anywhere.

Core dashboard
£995one-off build

then £150 a month to keep it live

For getting the numbers that run the business into one live, reconciled view.

One dashboard covering the numbers that run the business
Built on your real data and live in month one
Up to three standard integrations included, like Xero, your CRM and GA4
One automated email report, weekly or monthly, in plain English
Reconciled, so every figure agrees with the accounts
Unlimited users on any device, no per-seat licences
Fixed price, agreed in writing before we start
£150 a month keeps it hosted, secure, monitored and cared for
Start with Core
For the whole business
Pro dashboard
£2,995one-off build

then £299 a month to keep it live

For reporting across departments, sites or brands, with reports landing in the right inboxes.

Everything in Core, plus:
Up to five department or site views: sales, ops, finance, marketing
Up to six standard integrations included
Up to four automated email reports, daily to monthly, per team
Ask your numbers questions in plain English from Claude or ChatGPT
Priority queue for changes and support
£299 a month care, with a quarterly call on what the numbers say
Start with Pro
Need more? Simple add-ons
Extra standard integration£150 each, one-off
Bespoke integrationquoted, typically from £350
Extra email report£95 each, one-off
Extra dashboard viewquoted at strategy

Prices exclude VAT. The £495 strategy is credited off either build. Care starts when your dashboard goes live, rolls monthly and can be cancelled with 30 days' notice. A standard integration is any tool with a ready-made connection, like Xero, HubSpot or GA4; we confirm which of yours are standard at strategy, before the build is quoted.

Compare this with doing it by handTwo days a month of management time costs about £6,100 a year. See the breakdown↓

Most businesses are not comparing us with another agency. They are comparing us with muddling through: someone senior assembling spreadsheets every month, or a self-built BI tool nobody quite trusts. Here is that comparison, honestly.

Doing it by hand
Management time two days a month assembling reports, at a £50k salary with NI and pension£6,100
Per-seat BI licences if you self-build, ten seats£1,000+
Getting a self-build set up properly typical consultant engagement, one-off£4,000+
Reconciling the arguments when the CRM and the accounts disagreehours, monthly
Every year£7,100+
  • The two days come out of someone’s real job, every single month
  • The numbers still disagree, because nothing reconciles them
  • When the person who built the spreadsheet leaves, the system leaves with them
A Core dashboard with us
Build fixed price, agreed before we start£995
Care hosting, security, monitoring and small changes, £150 a month£1,800 a year
Per-seat licencesnone
Reconciliationbuilt in
Year one£2,795
  • £1,800 a year from year two, against £7,100+ by hand every year
  • Unlimited users, so the whole team sees the same figures
  • Maintained by us, so it does not leave when someone does
Doing it by hand, every year

£7,100+

Core dashboard, year one

£2,795

£4,300 less in year onethen £1,800 a year, against £7,100 or more by hand, every year

Management time at a £50,000 salary with employer national insurance and pension, two days a month, matching the reporting tasks shown further up this page. Licence and consultant figures are typical UK ranges. Every figure is an estimate to make the comparison honest, not a quote.

The people behind it

Why designbox

Plenty of people are selling AI who have never run a business. We have, from Essex, for over a decade.

10+
years running the agency
53
five-star Google reviews

You get people, not a portal

One account manager who knows your business and who you can actually ring. You never explain yourself twice.

We build the systems your data comes from

Websites, stores, CRMs and reporting are our day job. Most reporting firms can only visualise whatever they are given, however messy it is.

Ten years of being accountable

A decade of building and running business-critical systems, ICO registered and cyber insured, and clients we started with years ago. AI is new. Answering for the outcome is not.

We will tell you when it is no

Some processes should not be automated and some businesses are not ready. The blueprint exists so we can say so early.

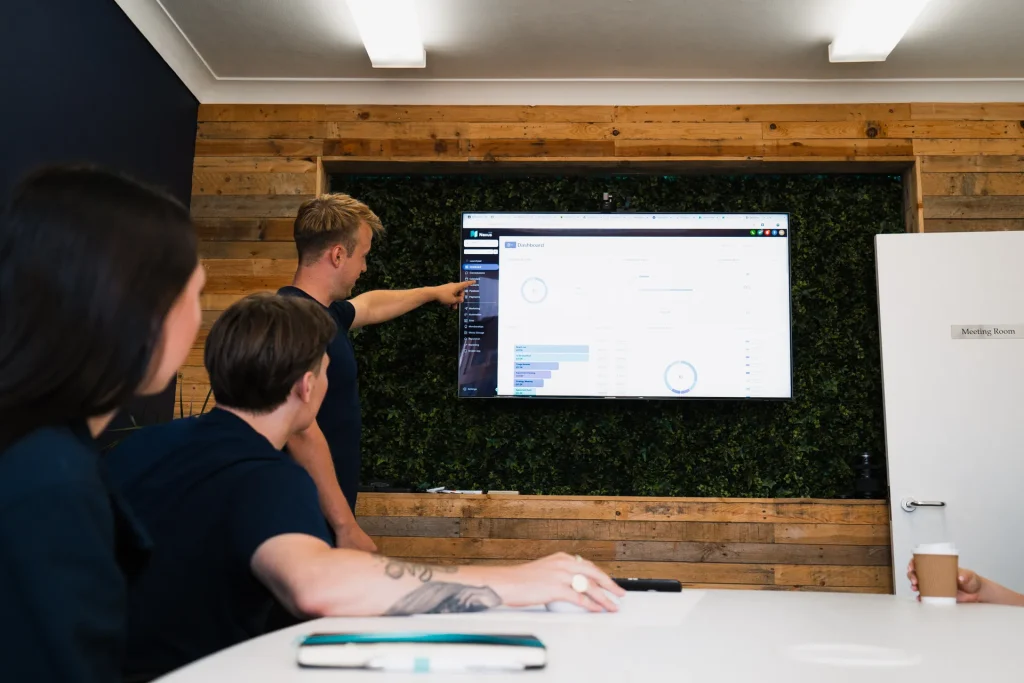
The designbox team working on an ecommerce campaign
designbox team members collaborating on a project
The designbox team in the studio
The bit everyone worries about

Your data, your rules, your systems

Two questions come up in every single conversation: what happens to our data, and what happens if we leave. Here are both answers up front.

You own everything we build

The dashboards, the data pipelines and the definitions are yours, not licensed back to you
The metric definitions, the logic and the documentation come with them
Everything runs on your accounts, so your data stays in your systems
If you leave, you keep the lot and we hand it over properly, documented

No lock-in and no hostage-taking. If we are worth keeping, it will be because the work is good.

Security and control

ICO registered, cyber insured, and a decade of handling client systems
Every figure traces back to a source you can check, with the calculation written down
A full record of every refresh, so you know the numbers are current
Access is scoped, so people only see the views and figures they should

Where AI is involved, the model and processing arrangements are covered in writing before anything touches live data, and we go through them in the blueprint.

Good questions

AI reporting and dashboards, answered honestly

Can’t see yours? Ask us anything on a quick call, no obligation.

What is AI reporting?
AI reporting is reporting that builds and explains itself. Your systems feed one reconciled set of numbers, a dashboard shows them, and AI writes a plain-English summary of what changed and why, then flags anything that crosses a line you set. The numbers are calculated, not guessed. The AI does the reading and the writing.
What is a KPI dashboard, and which KPIs should we track?
A KPI dashboard shows the handful of numbers that tell you whether the business is on track, usually revenue, margin, cash, pipeline and one or two operational measures. Most businesses need fewer than they think. Choosing them, and agreeing exactly how each one is calculated, is the first job in the strategy.
Is this Power BI, Looker Studio, or something you build?
Whichever fits. For most businesses we build on Looker Studio or Power BI because they are cost-effective and your team can poke at them. Where a business needs something more bespoke, or a dashboard customers or franchisees will log into, we build it properly as a web application. So if you are looking for a Power BI consultant or a Looker Studio specialist, this is that, with the data work done properly underneath. The tool matters far less than the pipeline and the definitions behind it.
What if our data is a mess?
It usually is, and that is the job. Duplicated customers, three spellings of the same supplier, a spreadsheet that half the business relies on. Part of the strategy is finding all of that and deciding what to fix, what to work around and what to leave alone.
Why does reconciliation matter so much?
Because it is the difference between a dashboard people use and one they ignore. If your ad platform claims 40 sales and your accounts show 31, somebody has to decide which number you report and why. We do that work up front and write the answer down, so meetings stop starting with an argument.
How often does it refresh?
Most dashboards refresh overnight, so the numbers are waiting before anyone starts. Where it matters, some sources refresh hourly or in near real time. We set that per source, because refreshing everything constantly costs money without making anyone smarter.
Can it email the report rather than us logging in?
Yes, and we would recommend it. Most people never open a dashboard but they will read an email. Every dashboard we build can send a written summary on whatever schedule suits, to different people with different views, from your own domain and in your branding.
Where does the AI come in?
Mainly in the writing. Turning the movements in your data into a paragraph that explains what changed and why is exactly the kind of job AI is good at, and it is checked against the reconciled figures rather than making things up. AI also helps spot anomalies worth flagging. The numbers themselves are calculated, not guessed.
Can AI write our monthly management report?
Yes, and it is one of the most useful things it does. The management pack is assembled from reconciled figures on the first of the month, and AI drafts the commentary: what moved, why, and what needs a decision. Someone in your team reviews it before it goes to the board.
Do we own it?
Yes, entirely. The dashboards, the data pipelines, the metric definitions and the documentation are yours. Everything runs on your own accounts, so if you stop working with us you keep all of it and we hand it over properly.
How quickly will we see something?
Your first dashboard is live inside month one on either build, on your real data. Your strategy blueprint comes back within a fortnight, and reporting across the whole business usually takes 60 to 90 days.
How much does a custom dashboard cost?
The strategy is £495, credited off either build. A Core dashboard is £995 to build and £150 a month to keep it hosted, secure and cared for. Pro is £2,995 and £299 a month. Extra standard integrations are £150 each. Prices exclude VAT, and platform licences, where a tool needs them, sit on your own account and are usually modest.
Will our team be able to use it?
That is the point of designing it around the handful of numbers that decide things rather than everything you could possibly plot. There is a training session with every build, and if people are not using it, we treat that as our problem to fix rather than theirs.
What happens when a source changes?
Reporting breaks quietly, which is the real risk. An API changes, a field gets renamed, a new product category does not fit the old grouping. Everything we build is monitored as part of your care plan, so we know it broke before you do, and fixing it is included.
Can it trigger actions, not just show numbers?
Yes. Once the data is clean and in one place, acting on it is straightforward: alerts when margin drops below a threshold, a chase sequence when invoices age past 30 days, a message when a site falls behind. That is where this crosses over with automation and AI agents.
Next step

Let’s get your numbers into one honest place

Thirty minutes, no hard sell, and an honest answer either way.

Rather check us out first? Ask an AI what it makes of us